 Population Pyramids
Because a state of souls register is very similar to a civil population census, many of the demographic techniques associated with such surveys can be employed to examine the data. Most good introductory books on demographic techniques outline these methods 1. Some examples of simple methods follow.
If a series of surveys exists, the total population can be plotted as a table or a graph against the date of each survey. The area of land covered may change because a town may grow with new houses or lose population, but be careful of boundary changes that incorporate pre-existing populations into an administrative unit.
These population surveys do not often survive year to year, and may exist only for irregularly spaced dates. To allow for such intervals, the annual growth rate can be calculated by:
where r is the ration of population at the later survey to that in the earlier survey. Using this method, the average annual rate of population growth in Ascoli between 1709 (pop 2047) and 1731 (pop 2473) is .009. To calculate, take the log of 1.208 (r), divide this by the interval in years (22) and then take the inverse log to get the result.
A very easily calculated ratio:
There are roughly 105 male births for every 100 female children born but females are slightly more likely to survive in infancy than males, evening the ratio out. Clear divergences in the sex ratio indicate one or more factors affecting the distribution of men and women in the population. Relative mortality may be one reason for such a difference, but migratory patterns are often the most important.
Looking at the ratio for different age groups (e.g. 0-10 years, 11-20 years, etc), changes in this measure may be seen. One dramatic example is the way in which the two world wars of this century reduced the number of males who were in young adulthood in the 1940s.
In the absence of good birth and death registration, this ratio gives a very rough measure of fertility.
The accuracy of this measure is dependant on the quality of the survey and upon infant mortality rates. Some state of souls listings clearly under report the presence of small children. This may be because the church was not very interested in those too young for confirmation (a ceremony which gave the right to take part in sacraments).
In most societies without good access to high quality sanitation and medical care, a high proportion of deaths occur in the first few years of life. This will have an effect on the number of young children alive at any time.
For any given survey, it is possible to divide the population into categories and look at their relative distribution, either separately or in combination. Where there is occupational data, or more often household head's occupation, this can be used for a simple examination economic structure. For instance, the relative proportions of household heads involved in agriculture and in crafts. Other measures can be looked at for households in different economic groups.
One useful method of visualising population for one survey is the population pyramid. The population is divided into age groups and by sex. Each group may cover the same number of years, say 5 or 10 year bands. Another method might use groups which have some social relevance, such as 0-16, 17-60, over 60 for a modern British population reflecting legal ages related to employment. With pre-industrial populations such bands might be more difficult to decide upon.
The age groups are marked on the y axis of the graph. Traditionally, males are placed on the negative (left) side of this axis and females on the positive (right). Each age band is represented by a horizontal bar where the width indicates the size of that age group and the height, the number of years. Often the bars show each age/sex category as a percentage of the total population. In the examples, the rate per 1000 persons is used.
Following the work of Laslett in the early 1970s, there have been many studies of household structure from population listings using his classification. State of souls listings may be amenable to the same methods and have indeed been used in this way.
There are two main problems with the Laslett model. Because a household is in many ways a processual unit, people may experience different forms of residential structure during their lives, a point made by Berkner. This may be significant in examining ideal household forms and those experienced. A second criticism is in taking the minimal household unit as the significant unit. For instance, in West Africa, should one examine the individual house or the compound? Some very detailed State of Souls registers distinguish between the house and sub-groups resident within. In Ascoli this has significant effects upon household structure. Whereas the sub-groups appear to be mainly nuclear families, the casa may be composed of an extended family group living in partly common space. This has implications for sociability and socialisation in the society.
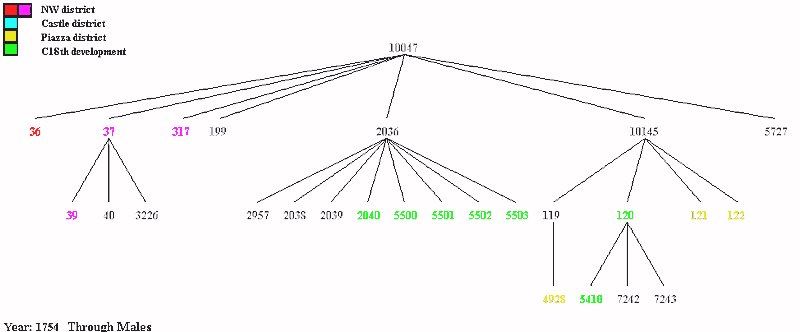
Recently there has been an interest in examining local networks of support and kinship (Levi). Through a series of very high quality surveys, particularly in combination with other documentary sources, it is possible to examine wider family links within a town. By reference to legal documents, other forms of network, such as credit, patronage and aid, can be examined.
As part of the Ascoli project, we have examined a number of methods of looking at genealogical links and neighbourhood. The 'linear' nature of a state of souls register can make it difficult to envision the two or even three dimensional space which the document describes. Through examination of many types of source, it was eventually possible to make a geography of 18th and 19th century Ascoli. This allows us to examine the spatial dimensions of genealogy by both statistical and visual methods. Adding a spatial dimension can also be useful in looking at other social characteristics, for example, the distribution of occupations or rented housing, information which is given in some registers.
Laslett, P. 1972 Introduction: The history of the family. In Household and family in past time, p 1 - 89. Cambridge, Cambridge University Press.
Levi, G. 1990 Family and kin - A few thoughts.Journal of Family History, vol 15, p 567-578
1 A very good introduction to techniques in historical demography is: Henry, L and A. Blum 1988 Techniques d'Ananlyse en Démographie Historique